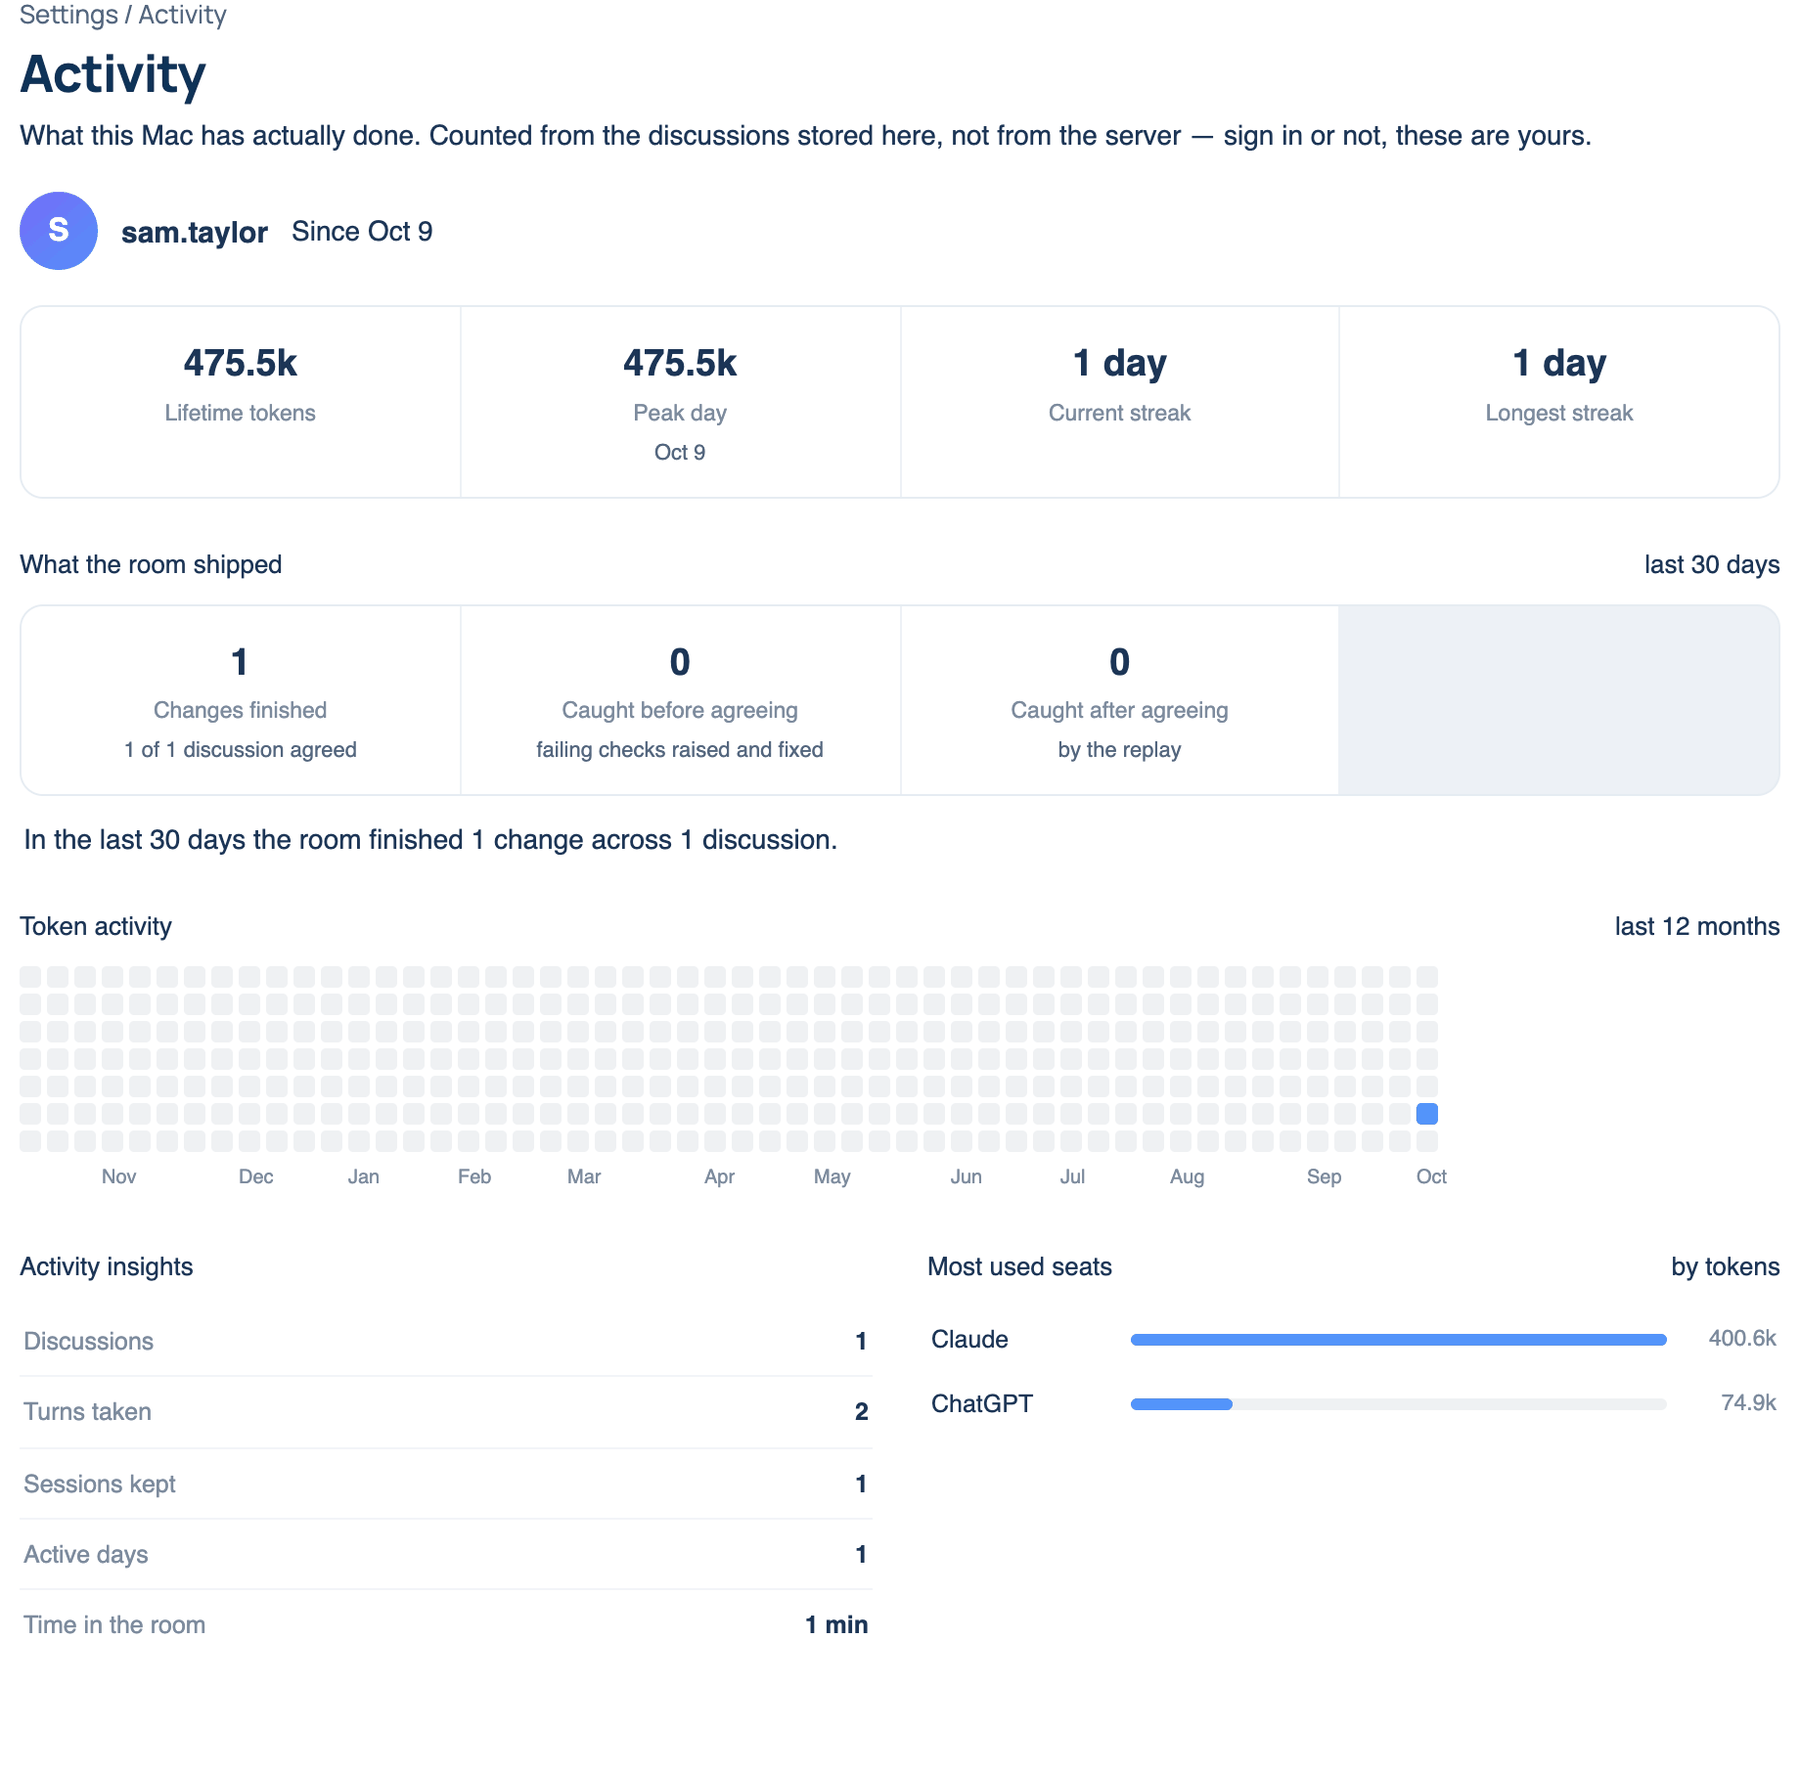
Mac only. Settings → Account → Activity is read-only. Every figure is counted from the discussions stored on this Mac, from the timings each one recorded for its own footer. Nothing is measured or sent anywhere to build it, and it works signed out. The web and iPhone show spend under Billing → Spending instead.
The tiles
| Tile | What it counts |
|---|---|
| Lifetime tokens | Every token any seat used here |
| Peak day | The busiest day, and its date |
| Current streak, Longest streak | Days in a row with a discussion |
| Lines the room wrote | Lines added and removed by the room, counted as written. Shown once there are any |
What the room shipped
Shown when there are finished runs in the period. Changes finished is how many discussions ended agreed. Caught before agreeing counts failing checks raised and fixed during the discussion. Caught after agreeing counts what the replay found once the seats had agreed. Cost per change is the average; it leaves out subscription CLI seats, which have no per-call price, and says so. Later reverted follows the commits the room made and counts the ones undone afterwards.
When to use it. To answer "is this worth what it costs" with numbers instead of a feeling, or to see whether the replay is catching anything.
When not to use it. For billing. Spending on the server is in Settings → Billing → Spending, which includes runs from the web and phone.
Token activity and the rest
Token activity is a year of days as a grid, darker for busier days, on a log scale so an ordinary day still shows. Hover a square for its date and count. Activity insights lists Discussions, Turns taken, Sessions kept, Active days, Time in the room and Spent on tokens. Most used seats shows the six seats with the most tokens.
With no discussions yet it reads "Nothing to show yet".